
Commercial Vehicle Comparison Guide
Commercial EV vs Traditional Utility Vehicle
A data-driven comparison of electric commercial vehicles against traditional petrol and diesel utility vehicles across ownership cost, maintenance, downtime, fleet efficiency and urban sustainability. Built for fleet managers, procurement teams and small business operators making long-term vehicle decisions.
4
EV wins
1
Depends
0
Traditional wins
5 dimensions, side by side
| Dimension | Commercial EV | Traditional Utility Vehicle | Verdict |
|---|---|---|---|
| Ownership cost | Higher acquisition cost; significantly lower energy and maintenance cost; total 3–5 year cost typically lower for urban operations | Lower acquisition cost; higher fuel, oil, servicing and repair costs; total cost rises with mileage and age | EV wins For operations above 15,000 km/year in urban environments, EV total cost of ownership is typically lower within 3 years. |
| Maintenance | No engine oil, no exhaust, no gearbox, no timing belt; brake wear reduced by regenerative braking; primary maintenance: tyres, battery health monitoring | Regular oil changes, filter replacements, exhaust servicing, gearbox maintenance, timing belt replacement; maintenance cost increases with age and mileage | EV wins Electric drivetrains have approximately 20 moving parts versus 2,000+ in a combustion engine. Fewer parts means fewer failures. |
| Downtime | Lower unplanned downtime due to fewer mechanical failure points; planned maintenance intervals longer; charging requires scheduling but overnight depot charging eliminates mid-day stops | Higher unplanned downtime risk from mechanical complexity; fuel stops add 10–15 minutes per day; breakdown frequency increases with vehicle age | EV wins Unplanned downtime is the highest-cost vehicle event for a fleet. EV's mechanical simplicity reduces this risk significantly. |
| Fleet efficiency | Consistent performance regardless of fuel price volatility; predictable energy cost per km; telematics integration for route and charge optimisation; no idling fuel cost | Performance and cost affected by fuel price fluctuations; idling cost significant in urban stop-start operations; no energy recovery from braking | EV wins Fleet operators report 15–25% improvement in cost predictability after switching to electric platforms on urban routes. |
| Urban sustainability | Zero tailpipe emissions; LEZ-compliant; no noise pollution; eligible for urban access incentives in many markets; positive brand signal for sustainability-focused clients | Tailpipe emissions; subject to LEZ restrictions and future tightening; noise pollution in residential areas; increasing regulatory risk in urban markets | Context-dependent For operations in markets with active LEZ enforcement, the traditional utility vehicle faces growing access restrictions. For rural operations, this dimension is less relevant. |
Ownership cost: why acquisition price is the wrong number to compare
The most common mistake in commercial vehicle procurement is comparing acquisition prices. A traditional utility vehicle that costs 30% less to buy can cost 60% more to operate over three years. Total cost of ownership — acquisition plus energy, maintenance, insurance and residual value — is the only meaningful comparison.
Energy cost
Electric vehicles cost 60–80% less per kilometre in energy than petrol or diesel equivalents on urban routes. At 50 km/day over 250 operating days, the annual energy saving is typically £1,500–£3,000 per vehicle depending on local electricity and fuel prices.
Maintenance cost
Electric drivetrains require no oil changes, no exhaust servicing, no gearbox maintenance and no timing belt replacement. Annual maintenance cost for an electric commercial vehicle is typically 40–60% lower than a comparable diesel vehicle.
Residual value
Electric commercial vehicles are retaining value better than diesel equivalents in markets with active LEZ enforcement. A diesel utility vehicle faces accelerating depreciation as urban access restrictions tighten.
Simple 3-year TCO model: Acquisition cost + (annual energy + maintenance + insurance) × 3 − residual value. For urban operations above 15,000 km/year, run this model before comparing sticker prices.
Maintenance: the mechanical complexity gap
The maintenance cost difference between electric and combustion commercial vehicles is structural, not marginal. It is a direct consequence of mechanical complexity.
Electric commercial vehicle — maintenance schedule
- TyresEvery 20,000–30,000 km (standard)
- BrakesExtended interval due to regenerative braking (typically 2× longer than combustion)
- Battery healthAnnual diagnostic check
- Cabin filtersAnnual replacement
- Fluid top-upCoolant check (no engine oil)
Annual cost estimate: £300–£600 typical
Traditional utility vehicle — maintenance schedule
- Engine oil + filterEvery 10,000–15,000 km
- Air filterEvery 20,000–30,000 km
- Spark plugs / injectorsEvery 30,000–60,000 km
- Timing beltEvery 60,000–100,000 km (high cost)
- Exhaust systemInspection every 2 years; replacement as needed
- Gearbox serviceEvery 60,000–80,000 km
Annual cost estimate: £800–£1,800 typical (rising with age)
The timing belt replacement alone — typically £400–£800 — can exceed the entire annual maintenance cost of an electric commercial vehicle.
Downtime: the hidden cost most fleet managers underestimate
Downtime has two components: planned (scheduled maintenance) and unplanned (breakdowns, repairs). Electric commercial vehicles reduce both. The unplanned component is where the real cost difference lies.
Fewer failure points
An electric drivetrain has approximately 20 moving parts. A combustion engine has 2,000+. Each additional moving part is a potential failure point. The statistical probability of unplanned breakdown is significantly lower in electric platforms.
Longer service intervals
Electric commercial vehicles require fewer scheduled maintenance visits per year. Fewer workshop visits means fewer days off the road and lower labour cost.
Combustion breakdown profile
Combustion utility vehicles experience increasing breakdown frequency with age and mileage. Common failure modes: alternator, starter motor, fuel pump, injectors, exhaust components. Each failure means unplanned downtime.
Fuel stop time
A traditional utility vehicle requires fuel stops — typically 10–15 minutes per stop, 2–3 times per week for high-mileage operations. Over a year, this is 15–25 hours of non-productive time per vehicle.
For a fleet of 5 vehicles, reducing unplanned downtime by 2 days per vehicle per year recovers 10 vehicle-days of productive capacity annually.
Fleet efficiency: predictability, cost control and operational consistency
Fleet efficiency is not just about cost per kilometre. It is about predictability — the ability to plan, budget and operate without surprises. Electric commercial vehicles offer structural advantages in cost predictability that combustion vehicles cannot match.
Energy cost predictability
Electricity prices are more stable than diesel or petrol prices. Fleet operators who switch to electric platforms report significantly improved ability to forecast monthly operating costs. Fuel price spikes — which can increase diesel fleet costs by 20–30% overnight — do not affect electric fleets.
Route optimisation
Electric commercial vehicles integrate naturally with telematics and route optimisation software. Battery range data, charging status and energy consumption per route are available in real time. Traditional vehicles provide fuel consumption data but not the granular efficiency data that electric platforms generate.
Regenerative efficiency
In urban stop-start operations, regenerative braking recovers energy that would otherwise be lost as heat. On high-frequency urban delivery routes, regenerative recovery can extend effective range by 10–20% compared to highway driving. Traditional vehicles have no equivalent energy recovery mechanism.
For fleets operating 5+ vehicles on urban routes, the combination of lower energy cost, lower maintenance cost and improved predictability typically delivers a measurable improvement in fleet operating margin within 18–24 months.
Urban sustainability: regulatory risk and market access
Urban sustainability is not just an environmental consideration — it is a business risk factor. Low-emission zone enforcement is expanding across European, Asian and Middle Eastern cities. Traditional utility vehicles face growing access restrictions, compliance costs and reputational risk.
The regulatory trajectory
- 2030–2035Most major European cities have announced restrictions or bans on new diesel commercial vehicle registrations
- LEZ enforcementLondon, Paris, Amsterdam, Milan, Madrid and 200+ other cities have active LEZ schemes with financial penalties
- Emerging marketsUrban air quality regulations are tightening in Southeast Asia, Middle East and South Asia
- InsuranceSome markets are beginning to price diesel commercial vehicle insurance at a premium due to regulatory risk
A diesel utility vehicle purchased today may face access restrictions in its primary operating area within its useful life.
The EV sustainability advantage
- Zero tailpipe emissionsUnrestricted access in all current and planned LEZ schemes
- NoiseElectric operation is significantly quieter — relevant for early-morning and residential deliveries
- Brand signalSustainability-focused clients and procurement teams increasingly specify electric delivery as a requirement
- IncentivesPurchase grants, reduced road tax and preferential parking available in many markets
- Future-proofingNo regulatory risk from tightening emissions standards
In markets with active LEZ enforcement, the traditional utility vehicle's urban access is not guaranteed beyond its current registration period. Electric platforms carry no equivalent regulatory risk.
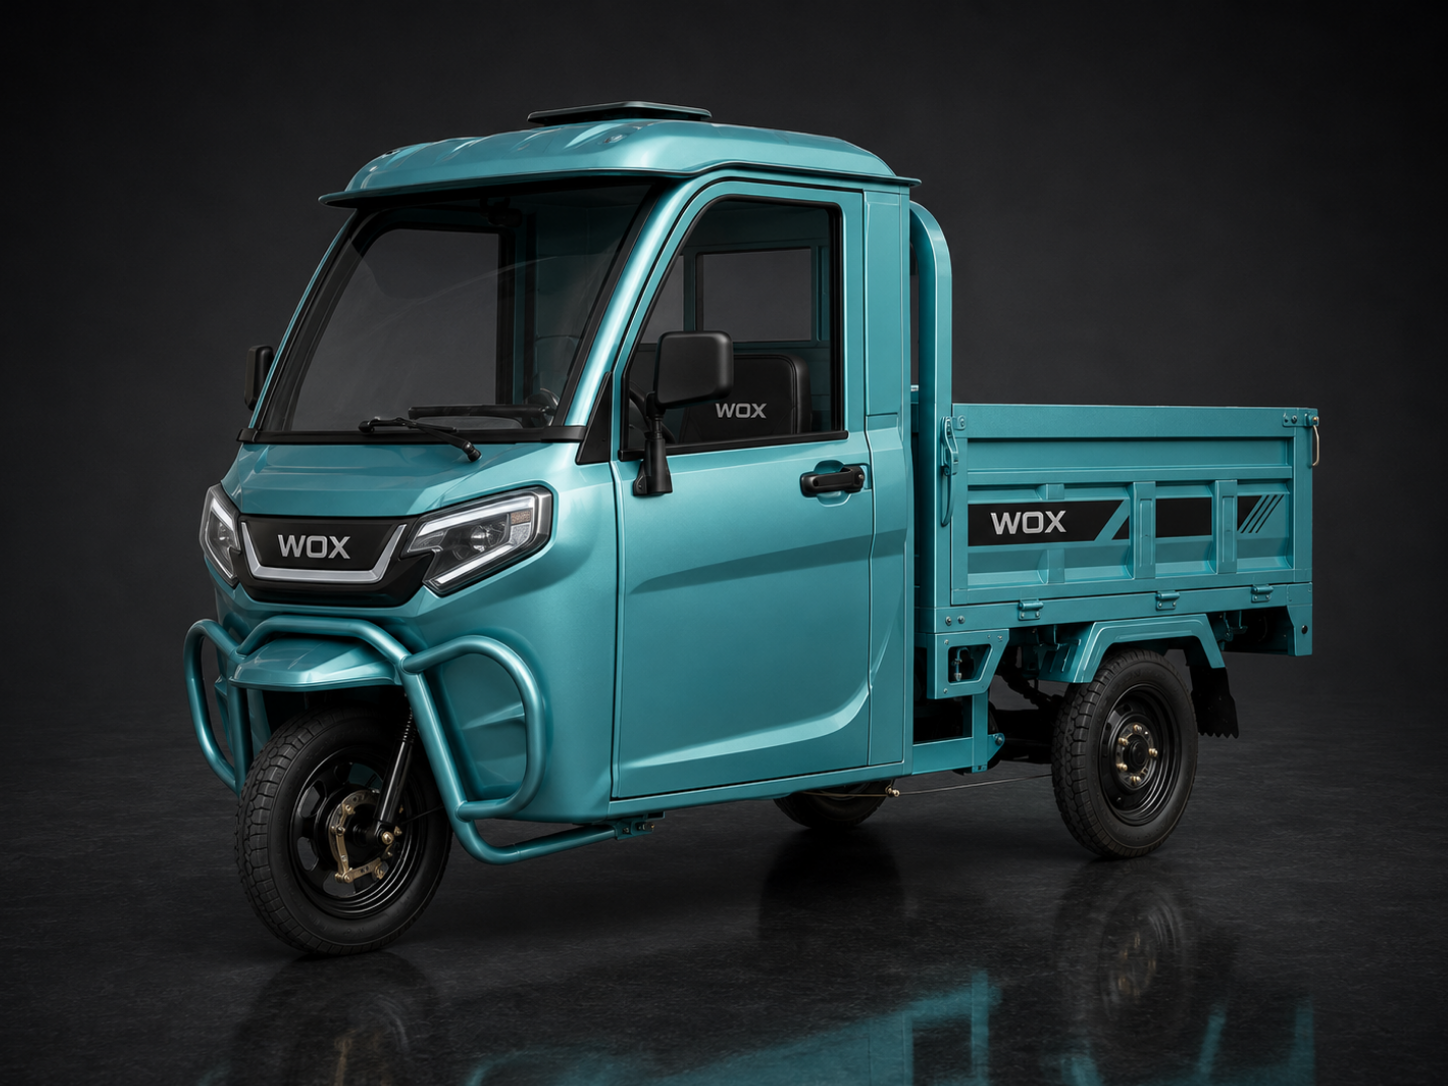
A commercial EV worth evaluating: WOX Carry
This guide is platform-neutral. The comparison above applies to any electric commercial vehicle versus any traditional utility vehicle. One platform that consistently meets the criteria for urban commercial operations is the WOX Carry.
The WOX Carry is an electric cargo tricycle designed for commercial urban delivery and logistics operations. Available in enclosed cabin, open flatbed and canopy cargo bed configurations.
- PayloadUp to 500 kg
- Range80–120 km per charge
- DrivetrainElectric — zero tailpipe emissions
- MaintenanceNo engine oil, no exhaust, no gearbox
- Body configsEnclosed cabin / Open flatbed / Canopy cargo bed
Evaluate WOX Carry against the criteria in this guide alongside other platforms before making a decision.
Frequently asked questions
Evaluating commercial vehicles for your fleet?
WOX Motor works with fleet operators, logistics businesses and distributors on commercial vehicle procurement. Contact us to discuss your specific requirements.
Related guides and pages
Join the Ecosystem